You open a pull request. The diff is clean, the description is written, and now you wait. Not for a reviewer. For the little yellow dot next to your checks to turn green. On our project that wait was about fifteen minutes, every single time, and almost all of it was one job: unit tests.
Fifteen minutes does not sound like much. Then you live it twenty times a day across a team and it starts to feel like a tax you pay on every commit.
The fifteen-minute tax on every PR
Here is how it actually played out. I push a branch, open the PR, and I cannot hand it to a reviewer yet because the checks are still running and nobody wants to review code that might be red. So I do one of two things, and both are bad.
Option one, I sit and watch the Actions tab like it owes me money. Fifteen minutes of doing nothing useful.
Option two, I switch to another task to stay productive. Then the checks finish, I have to climb back into the headspace of the first PR, remember what I was doing, re-read my own diff, and only then ping someone for review. That context switch is not free. By the time the PR is actually in review, half an hour of wall-clock time is gone and I have touched it three separate times.
Multiply that by everyone on the team. PRs piled up in a half-finished state, waiting to be assigned. Reviews started later, so merges landed later, so the next branch rebased later. The whole delivery cycle dragged, and you could feel people getting short about it in standup. Nobody likes being blocked by their own CI.
Where the time actually went
So I went looking for the fifteen minutes. It was not mysterious. We had a single unit-test job that ran the entire suite, around 430 Vitest files, on one runner.
To be clear, Vitest is not running those files one at a time. It spins up a worker pool and runs several files in parallel already. The catch is that the parallelism is capped by the cores on that one machine, and a standard GitHub-hosted runner only has a handful. So 430 files were all funneled through a single box, a few at a time, until the queue drained. I pulled the timing from a real run to be sure I was not exaggerating:
Before (single job): 887s ≈ 14m47s
Almost fifteen minutes of one machine grinding through 430 files as fast as its cores allowed. The tests themselves were fine. There were just too many of them for a single runner to clear quickly.
The idea was almost embarrassingly simple
Unit tests do not depend on each other. That is the whole point of a unit test. File A does not care whether file B ran first. So if one machine's cores were the ceiling, why not add more machines?
That is all sharding is. Run a sixth of the files on one runner, another sixth on a second runner, and so on, all at the same time. Each runner still parallelizes its own slice across its cores, exactly like before. You have just gone from one box doing everything to six boxes splitting the load.
The part I expected to be painful was wiring it up. It was not. Vitest already ships a --shard flag built for exactly this:
vitest run --shard=1/6   # run the first slice of the suite
vitest run --shard=2/6   # run the second slice, on another machine
Vitest splits the file list deterministically, so shard 1/6 always gets the same files. GitHub Actions has a matrix that spins up one job per value in a list. Put those two together and the suite runs six ways in parallel.
Splitting the suite across runners
The matrix did most of the lifting. I replaced the single job with six, each running its own shard, and told Actions not to bail the moment one shard fails so I still get the full picture:
unit-test:
  needs: [install-dependencies-and-caching]
  runs-on: ubuntu-latest
  strategy:
    fail-fast: false
    matrix:
      shard: [1, 2, 3, 4, 5, 6]
  steps:
    # cache restore for ~/.npm and node_modules is unchanged,
    # reused from the install-dependencies-and-caching job
    - run: >
        npm run test:unit:shard --
        --shard=${{ matrix.shard }}/6
        --outputFile=.vitest-reports/blob-${{ matrix.shard }}.json
    - uses: actions/upload-artifact@v4
      with:
        name: vitest-blob-${{ matrix.shard }}
        path: .vitest-reports/blob-${{ matrix.shard }}.json
Each shard writes a "blob" report, which is Vitest's portable format for partial results, and uploads it as an artifact. On its own a blob is useless. Together they are the whole run. The only real work left was collecting those partial results back into one report.
So the second job pulls all six blobs back down, merges them into one report, and runs the coverage annotation we already had on PRs:
unit-test-merge:
  needs: [unit-test]
  if: always()   # still merge even if a shard went red
  runs-on: ubuntu-latest
  steps:
    - uses: actions/download-artifact@v4
      with:
        pattern: vitest-blob-*
        merge-multiple: true
        path: .vitest-reports
    - run: npm run test:unit:merge
    # existing PR coverage annotation now runs on the merged coverage/lcov.info
The --merge-reports flag does the clever bit. It stitches the partial runs back into one result and merges the coverage numbers too, so the PR comment looks exactly like it did before. Reviewers never had to learn anything new.
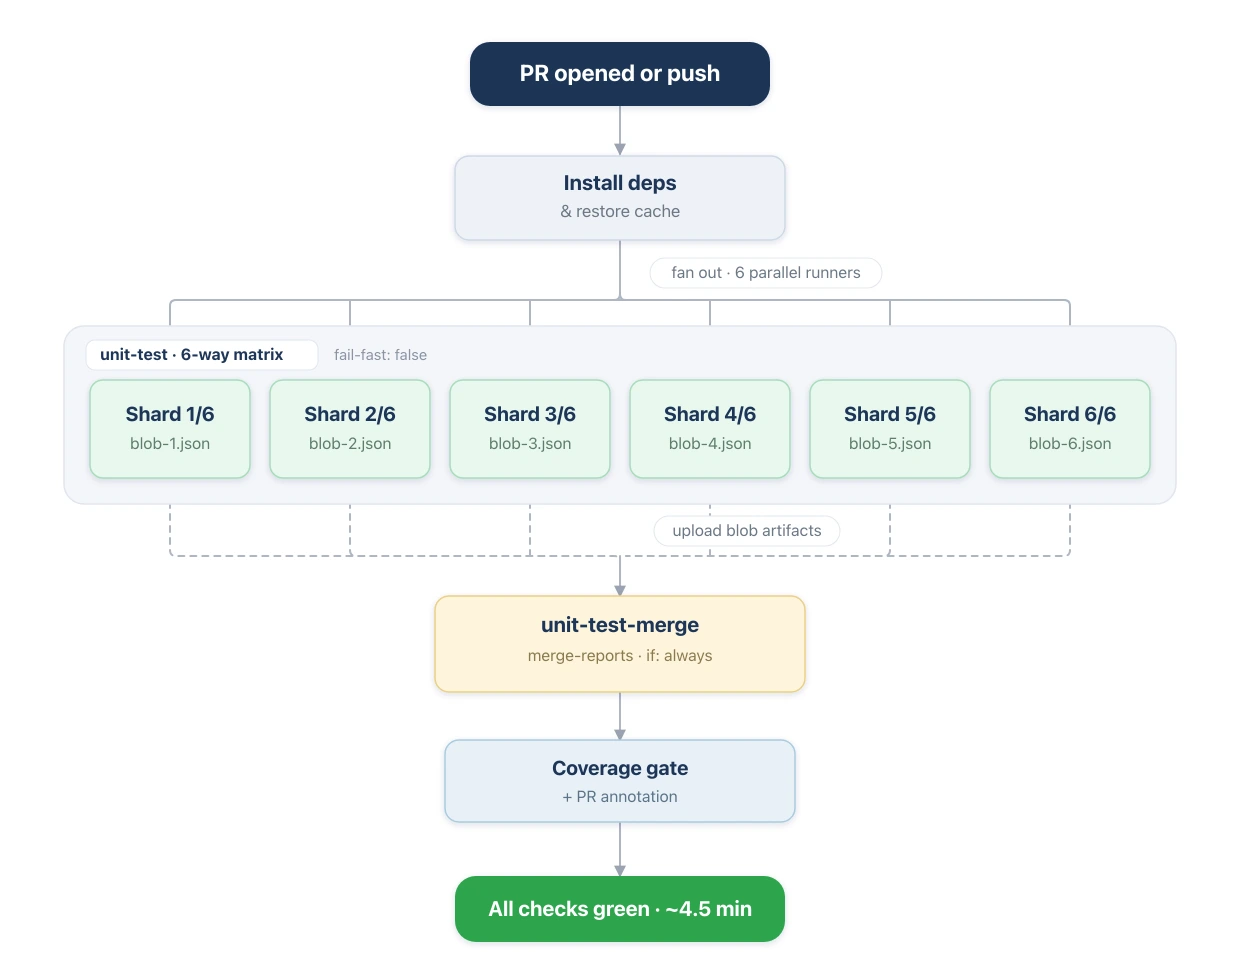
Here is the whole pipeline end to end: one job fans out into six shards, each writes a blob, and the merge job pulls them back into a single coverage report.
Two small config gotchas
I hit two problems that were not obvious, and both came down to one job now playing two roles. A shard run is not the same as the merged run, so I gated the behavior on an env var instead of hardcoding it.
The scripts stayed tiny:
{
  "test:unit:shard": "TZ=UTC VITEST_SHARD=true vitest run --coverage",
  "test:unit:merge": "TZ=UTC vitest run --merge-reports --coverage"
}
The first gotcha was the reporter going quiet. Passing --reporter=blob on the command line replaced the console reporter, so the shard logs showed no per-file output. You could not see which test ran where. The fix was to append the blob reporter in config instead of swapping it in:
const isCI = process.env.GITHUB_ACTIONS === "true";
const isShardRun = process.env.VITEST_SHARD === "true";

export default defineConfig({
  test: {
    reporters: [
      ...(isCI ? ["github-actions", "default"] : ["verbose"]),
      ...(isShardRun ? ["blob"] : []),
    ],
  },
});
Now every shard still prints ✓ src/.../Button.spec.tsx (12 tests) like it always did, and it also writes the blob.
The second gotcha was coverage thresholds failing on every shard. Of course they did. A single shard only sees about a sixth of src/**, so its coverage looks terrible compared to the real thresholds (lines 80, branches 85, functions 80, statements 80). If I enforced them per shard, every shard would fail.
The answer was to turn thresholds off during a shard run and enforce them once, on the merged report:
coverage: {
  thresholds: isShardRun
    ? undefined
    : { lines: 80, branches: 85, functions: 80, statements: 80 },
}
The merge job is not a shard run, so VITEST_SHARD is unset there, so the real thresholds come back and gate the merged numbers. Same safety net as the old single job, just checked in one place at the end.
The payoff
That is the whole change. Here is what it did to the wait, measured from real CI runs rather than guesswork:
| Setup | Slowest shard | Merge | Total unit-test wall-clock |
|---|---|---|---|
| Before (1 job) | 887s | n/a | ~14m47s |
| 4 shards | 271s | 58s | ~5m31s |
| 6 shards | 205s | 58s | ~4m25s |
About fifteen minutes down to about four and a half. Roughly a 70% cut, a little over three times faster end to end. The test execution alone got more than four times faster; the merge step is the only fixed cost we added back.
The same story, straight from the Actions tab. Before, one job carrying the entire suite:
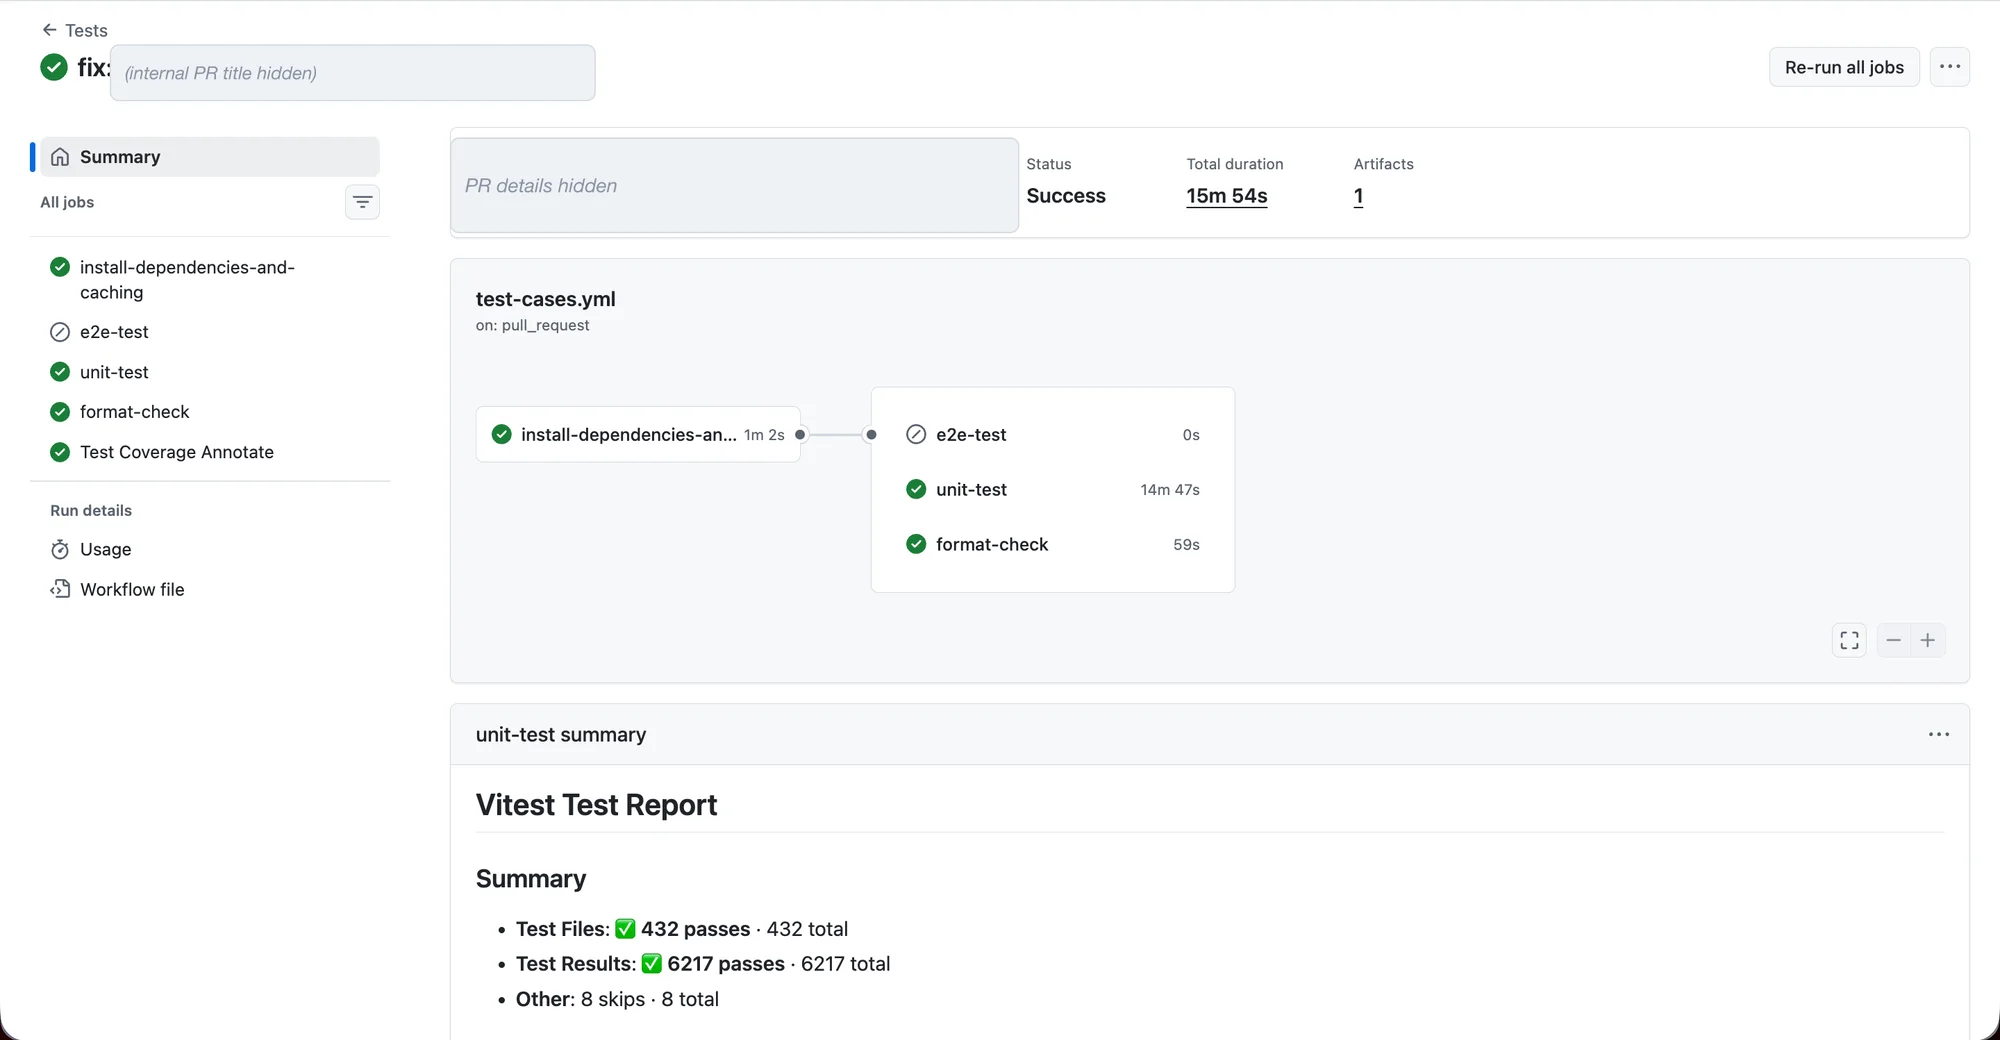
Before: one unit-test job runs all 432 files in 14m 47s (15m 54s total).
And after, the same suite split into six shards that run at the same time, with a small merge job at the end:
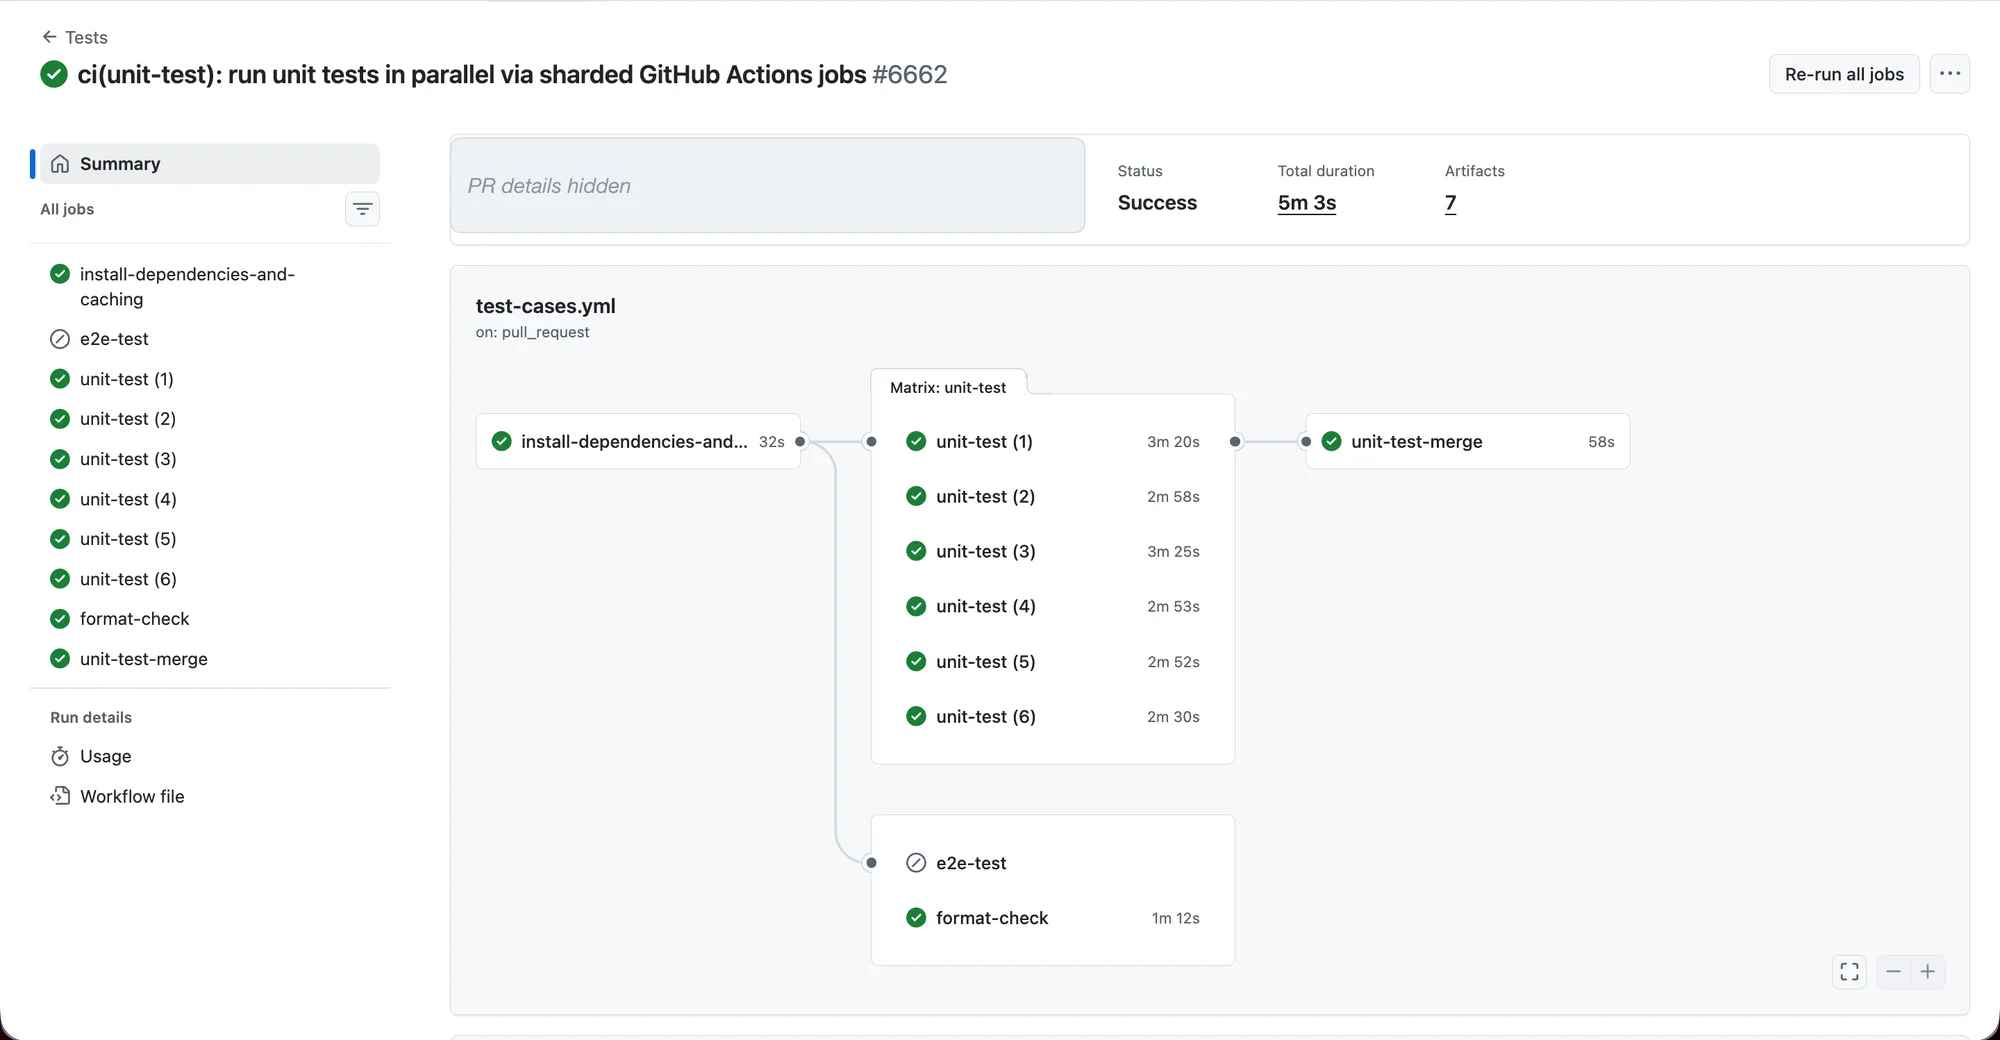
After: six shards run in parallel, the slowest finishes in 3m 25s, and the merge job adds 58s (5m 3s total).
The number on the dashboard is the boring part. The real change was what it did to the day. You open a PR, glance away to read a Slack thread, and the checks are already green when you look back. No task-switch tax. No half-finished PRs sitting in a queue waiting for permission to be reviewed. Reviews start sooner, merges land sooner, and the branch you were dreading rebasing is no longer three commits behind.
What I would tell you before you try it
A few things I learned that the docs do not put up front.
Tune the shard count in two places, not one. The matrix list and the /N divisor in --shard=${{ matrix.shard }}/N have to agree. I bumped us from four shards to six and forgot the divisor on the first try, which quietly runs only part of the suite. Change both.
More shards is not free. Six shards means six runners plus one merge runner per PR. Wall-clock keeps dropping as you add shards, but runner-minutes go up. We landed on six because the curve flattens out after that for our suite. Yours will flatten somewhere else.
The merge job still gates merges. If the full suite genuinely drops below the coverage thresholds, the merge job goes red, exactly like the old single job did. Sharding made the tests faster. It did not make them softer.
The part that actually mattered
Four files. That is the entire footprint of this change: the workflow, the Vitest config, the package scripts, and a line in .gitignore for the local blob reports. No test was rewritten. No code under test was touched. Nobody had to change how they work.
Nobody chose the slow setup. A single test job was just the shape the workflow took on day one, and it never got revisited as the suite grew from a handful of files to 430. That is the trap. Defaults are invisible, and they get more expensive while you are busy shipping features.
If your CI has one long test job and a team that groans every time they push, go check whether it can run in parallel. There is a good chance it already can, and you are one matrix block away from handing everyone those fifteen minutes back, on every PR they open.
Also available on Medium
This article is also published on Medium for interaction and feedback.